
England & Wales 3 Month Sales Change
Across England and Wales, the average sale value rose by 0.4% over the past three months. Depending on your location, your local sale value changes varied between a fall of 2.6% and an increase of 4.3% over the past three months.

England & Wales 3 Month Rental Change
Across England and Wales, the average rental value rose by 3.0% over the past three months. Depending on your location, your local rental value changes varied between a fall of 1.1% and an increase of 5.8% over the past three months.

London 3 Month Sales Change
Across London, the average sale value fell by 0.1% over the past three months. However, depending on your location the change varied between a fall of 2.7% and an increase of 2.6% over the period.

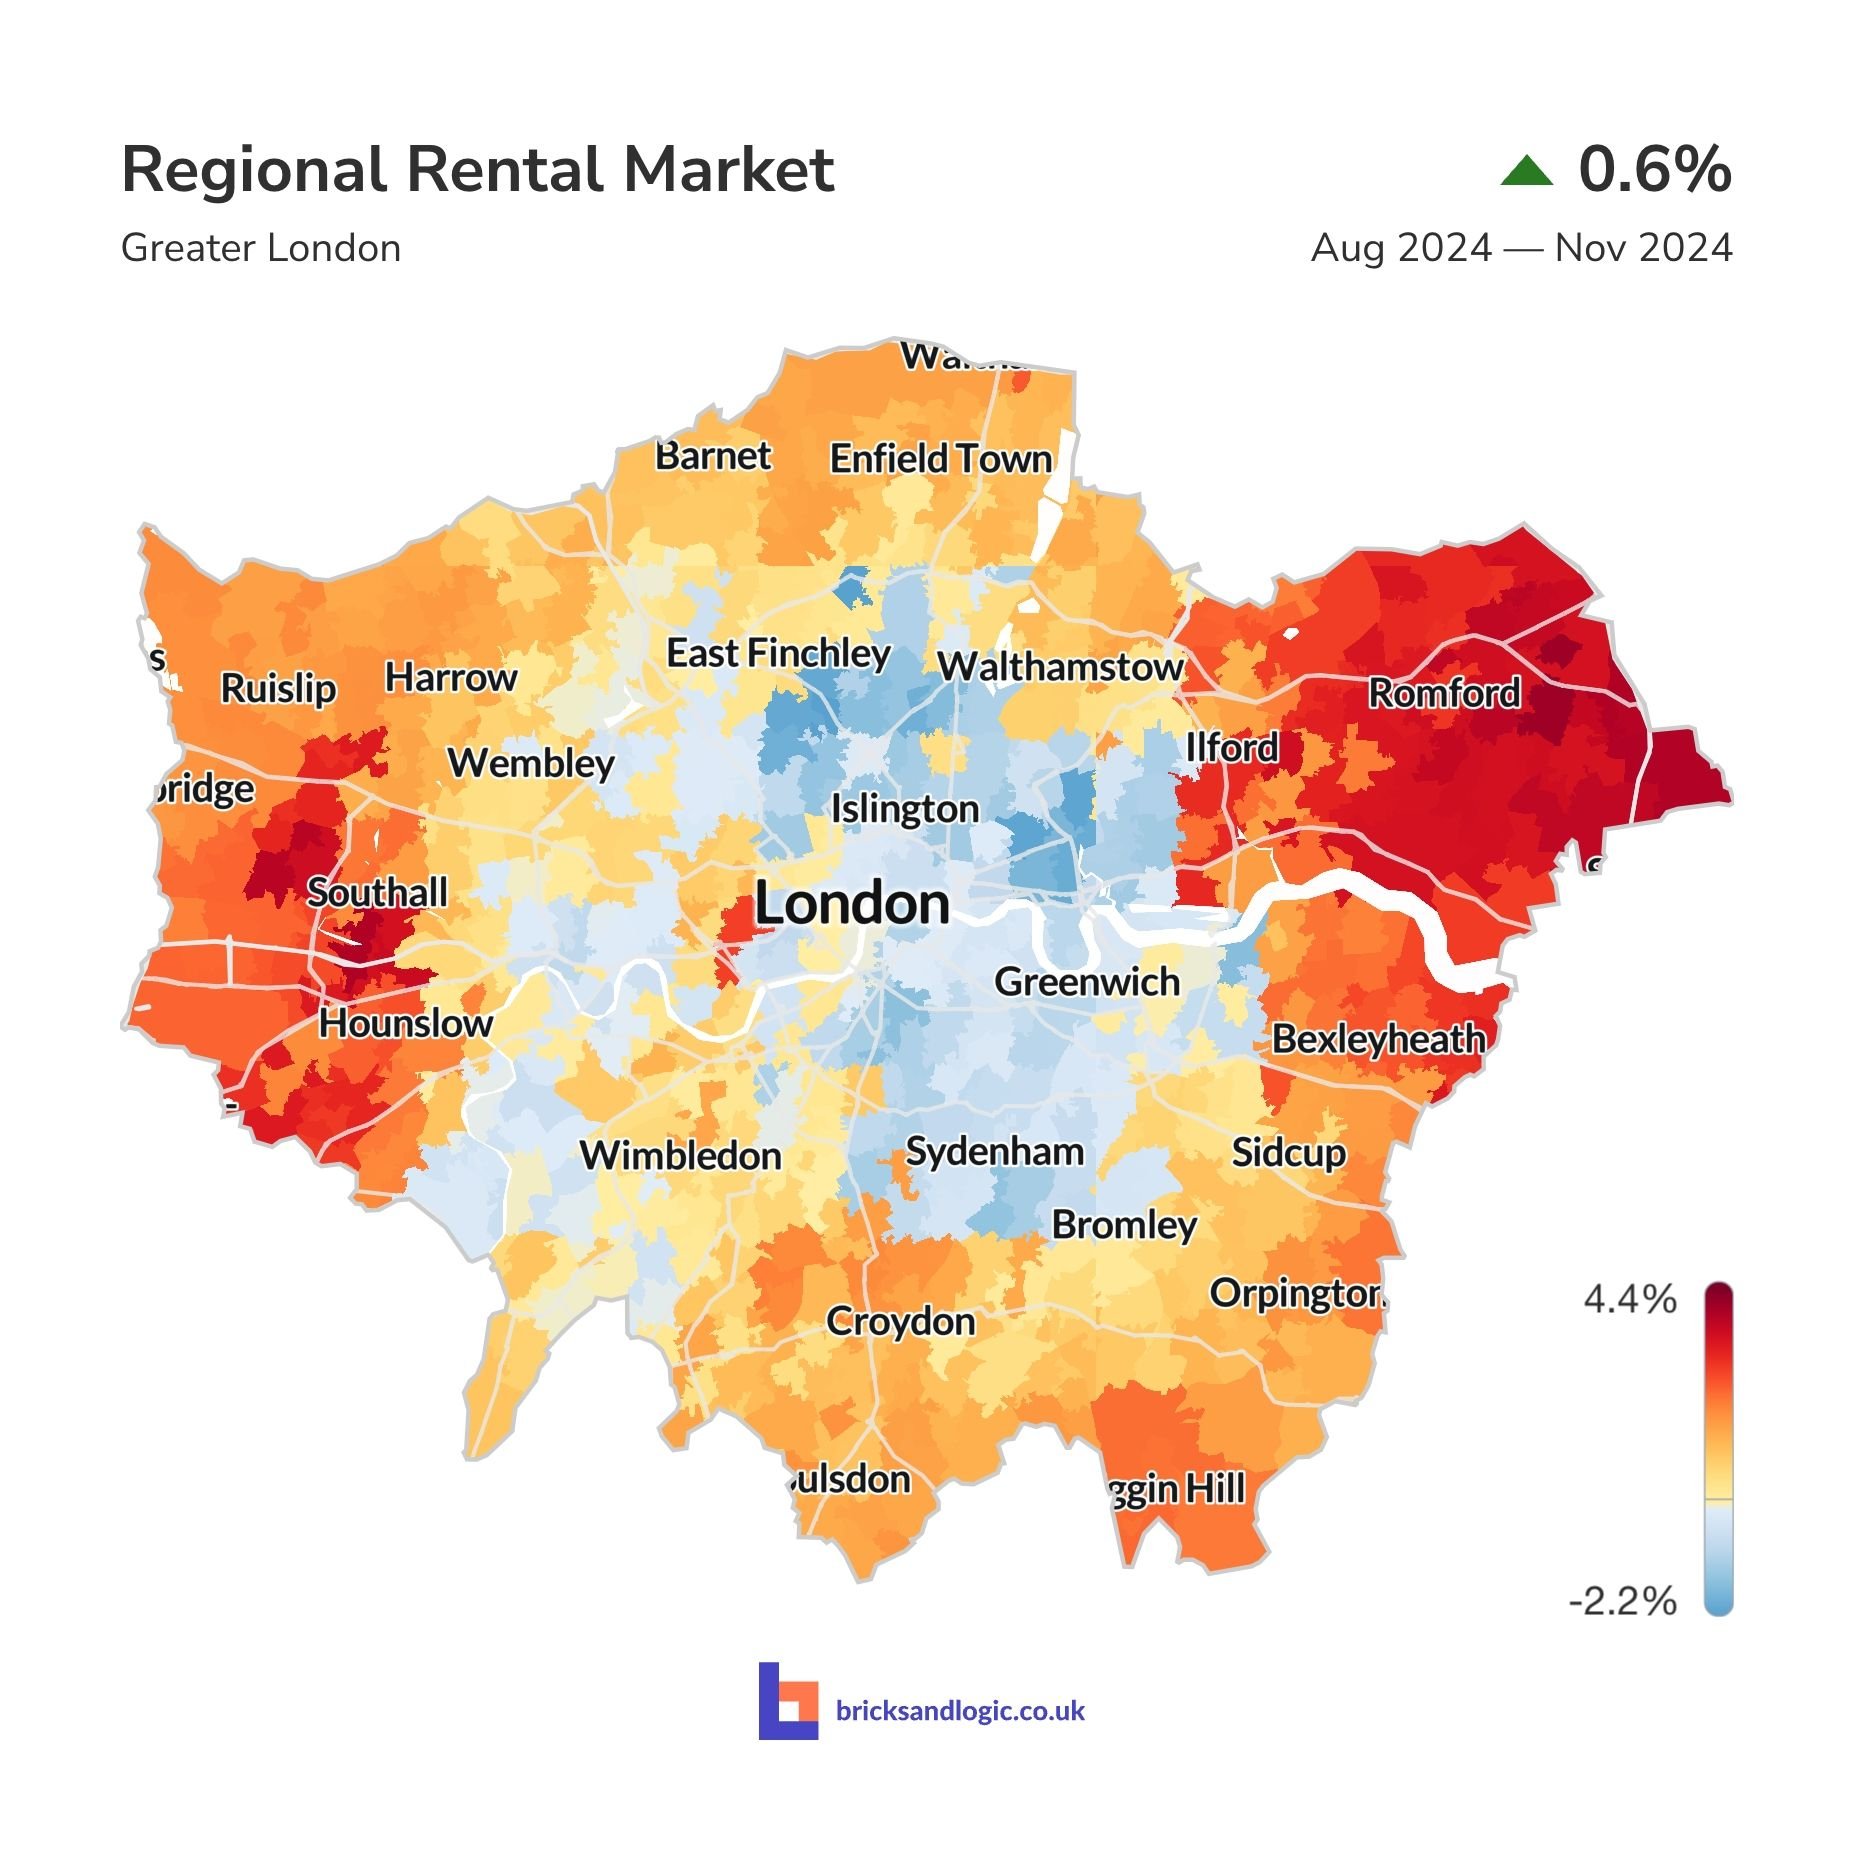
London 3 Month Rental Change
Across London, the average rental value increased by 0.6% over the past three months. However, depending on your location the change varied between a fall of 2.2% and an increase of 4.4% over the period.
As always, these numbers are area averages. Different types of properties in the same location can perform very differently to each other. To see how the market for your property has changed, log in at www.bricksandlogic.co.uk
If you like our work, please follow us on any (or all) of our social media channels!
Finally we would like to thank you for reading all year and wish you all a very Merry Christmas and a very Happy 2025.
- The Bricks&Logic Team


