Stay up to date
Stay up to date
Bricks&Logic is a trading name of Urban Markets Ltd
Company No. 11113204
|
VAT No. GB 287 0845 68
Registered Address: 2 Leman St, London E1 8FA
Be the first Estate
Agent here!

Accurate value estimates for 43, Lower Marsh Lane, Kingston Upon Thames are not possible with the data currently available.
To improve estimates in the area, log in and describe the property accurately.
It is likely, judging by nearby sales and lets, that the sale value falls between £563k and £701k, and the monthly rental value between £2.5k and £2.9k.
Lower Marsh Lane, Kingston Upon Thames, KT1 falls within the KT1 postal district, in the borough of Kingston upon Thames.

43, Lower Marsh Lane, Kingston Upon Thames has no recent1 records in either the Land Registry or EPC database.
The local information is scored as 4 out of 5 and is considered of high accuracy.
1Sales dated prior to 2007 are shown, but are not used in our calculations.

Area-wide, sale values have fallen by 0.1% over the last 12 months, with rental values up 2.9%.

HM Land Registry records the plot of land for 43, Lower Marsh Lane, Kingston Upon Thames as measuring 234 m2.
That makes it the 4th largest plot in the postcode, where 17 of the 20 other houses have recorded plot data.


The most recent sale of 43, Lower Marsh Lane, Kingston Upon Thames completed on 7th November 1997 at £102,000 and was recorded by HM Land Registry as a freehold house.
Since 1995 this is the property's only sale.

Over the past 2 years 3 properties have sold within 500 metres of 43, Lower Marsh Lane, Kingston Upon Thames, per the Land Registry and our network of Estate Agents.
The latest, on the 23rd January 2025, was 41, Lower Marsh Lane, Kingston Upon Thames, KT1 3BJ, a freehold house which sold for £665,750.
Read more about house prices in KT1.
•Nearby is defined as the radius comprising the nearest 2,000 addresses.


From 43, Lower Marsh Lane, Kingston Upon Thames, the nearest station is Berrylands, 800 metres away.

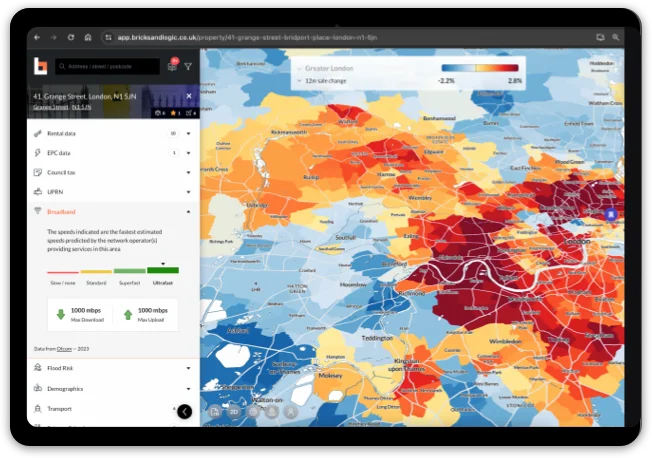
Broadband here reaches ultrafast speeds, based on recent Ofcom data.
According to recent data from Ofcom, Ultrafast broadband is available in the area.

The flood risk here is rated medium, based on Environment Agency data.

The recent census recorded whether a resident owned or rented their home.
In the area around 43, Lower Marsh Lane, Kingston Upon Thames, 43.8% of property is privately rented and 24.2% is privately owned outright.
The graph below shows how this compares to Greater London and the rest of England & Wales.

The recent census recorded the highest level of education achieved by residents in the local area.
In the area around 43, Lower Marsh Lane, Kingston Upon Thames, 37.1% of residents are recorded as possessing school level qualifications and 49.0% as possessing degree level qualifications.
The graph below shows how this compares to Greater London and the rest of England & Wales.

The most recent census in 2021 recorded the age of all UK residents.
In the area around 43, Lower Marsh Lane, Kingston Upon Thames, the average age was 37.1 and the most common age was 22.
The graph below shows how this compares to Greater London and the rest of England & Wales

The recent census recorded whether a property was a primary or secondary home for the resident.
In the area around 43, Lower Marsh Lane, Kingston Upon Thames, 1.5% of property was a second home.
Comparison figures for Greater London and the rest of England & Wales are listed below.

The recent census recorded the number of cars registered in each household.
In the area around 43, Lower Marsh Lane, Kingston Upon Thames, there are an average of 0.9 cars per household.
See below for how this compares to Greater London and the rest of England & Wales.