At Bricks&Logic, we have revolutionised house price indices by developing a unique approach that allows us to provide highly detailed insights into house price movements at the postcode and even property level.
What is a house price index?
House price indices are statistical measures that track changes in the price of residential properties over time. They are used to provide insight into the overall direction of the housing market, and are often used as a tool for forecasting future trends.
The most common house prices indices used in the UK
In the UK, there are several house price indices that are commonly used to track changes in the housing market. Some of the most widely recognised indices include:
- Nationwide House Price Index: The Nationwide index is based on mortgage data from one of the UK's largest mortgage lenders, and covers both new and existing properties across the country.
- Halifax House Price Index: The Halifax index is also based on mortgage data and covers new and existing properties across the UK. It is produced by one of the UK's largest mortgage lenders.
- Land Registry House Price Index: The Land Registry index is based on data from property transactions that have been registered with the Land Registry, and covers sales of all types of residential properties in England and Wales.
- Rightmove House Price Index: The Rightmove index is based on asking prices for properties that are listed on the Rightmove website, and covers both new and existing properties across England and Wales.
- Zoopla House Price Index: The Zoopla index is also based on asking prices for properties listed on the Zoopla website, and covers new and existing properties across the UK.
These indices differ in terms of the data they use, the methodology they employ, and the frequency of their release.
The Hedonic approach
There are several different types of house price indexes, but the most common is the hedonic index. A hedonic index measures changes in the price of housing by looking at the underlying characteristics of each property, such as its location, size, and number of bedrooms. By analysing these characteristics, a hedonic index can account for changes in the mix of properties that are sold over time, and can provide a more accurate measure of price movements.
However, using only the hedonic approach has a few significant limitations:
- Requires large datasets with detailed property information, limiting effectiveness in smaller areas with low transaction volumes
- Assumes that the value of property characteristics remains static over time, which can limit accuracy in accounting for changes in the market, such as changing demand for certain features like outdoor space following the COVID-19 pandemic
- When there is a significant change in the housing stock of an area (e.g. a large number of new build properties are built) it is difficult to account for their characteristics as there is no prior data available.
To address these limitations, the Bricks&Logic Index was developed.
Bottom up rather than top down
At Bricks&Logic we have developed a Digital Twin for every residential unit in England and Wales, providing us with a comprehensive understanding of each property's characteristics and location. Our mission was to create a unique index for every property, rather than creating indices by area. This approach would allow us to slice and dice indices by whatever characteristics and geographical areas we wanted, something not currently available from any of the existing house price indices.
However, as properties do not sell every month, it is impossible to rely solely on a hedonic approach. We therefore developed a hybrid model that combines the hedonic approach with machine learning algorithms and data science techniques. This approach provides a more accurate and granular view of the property market, enabling us to capture changes in the market that may be missed by other indices.
Clustering is key
To understand how a property's value is changing, we need to find the most similar sales to that particular property. However, as we explored our approach, we realised that just because two properties were located near each other, it did not mean their values were changing at the same rate. We wrote about this effect in one of our earlier blogs. We needed to assign sales of the "most similar" properties based on various factors, such as location, value, or attributes. By doing so, we could better understand the trends of specific property types in an area compared to the area as a whole.
The image below shows the Bricks&Logic heat map displaying sale price changes in Greater London between April 2020 and September 2021. The map on the left shows the performance of houses with gardens, while the right-hand map depicts the equivalent performance of flats with no outdoor space.
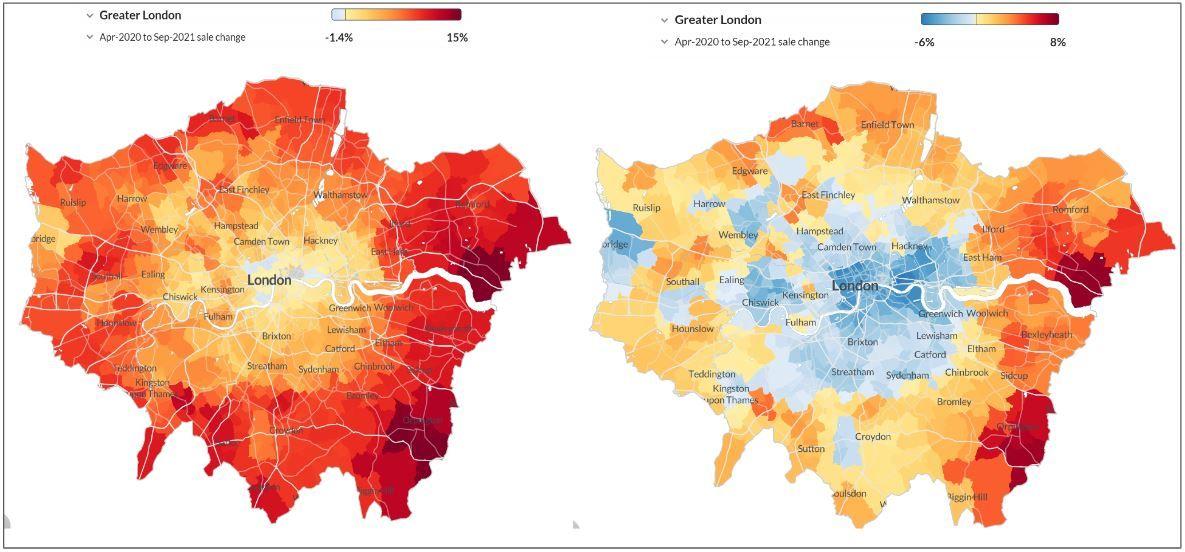
It is evident that houses outperformed flats during this period, with houses experiencing nearly universal increases in value across London, while flats in the city centre saw decreases and only experienced slight rises at the periphery.
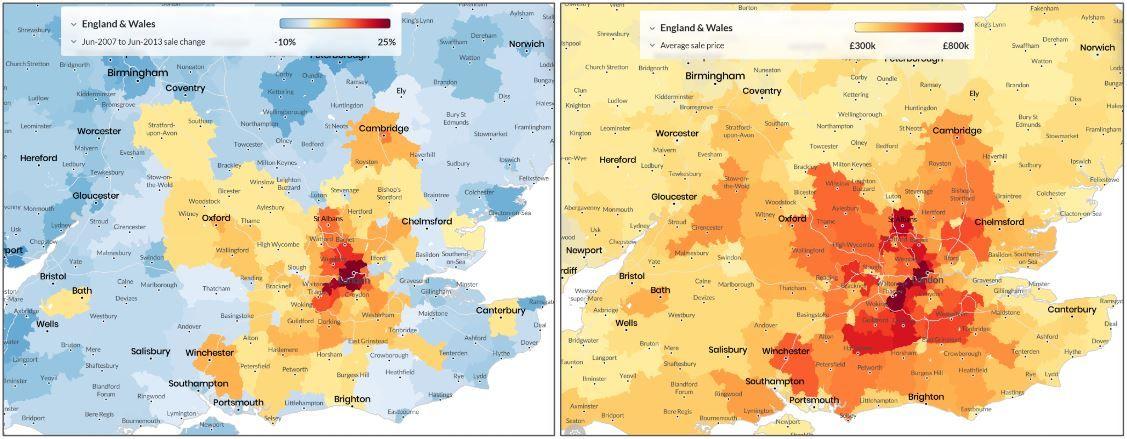
We also realised that certain areas behave similarly to other areas, but not necessarily neighbouring ones. The image on the left shows how property prices changed following the 2008 financial crash, while the image on the right displays the current average property values in those areas. It's evident from the images that the properties in more expensive areas like Bath, Cambridge, Oxford, Winchester, St Albans, and Canterbury moved similarly to those in Central London, indicating a common trend among these areas.
By using cluster analysis to understand the trends of areas, property types and characteristics we can blend all this information together to give an assessment of how the value of an individual property is moving.
Bringing the property market to life
Creating a property-level index enables us to paint an accurate picture of house prices on both a macro and micro level. To visualise this data, we have developed the Bricks&Logic heat map, which you can access for free on our website. We've explained how we created the map and how it can be used in another recent blog post. Additionally, our website allows users to explore indices by region, city, and almost any level they desire on the house prices page. For our professional users we have integrated all of these tools and visualisations into a unique set of digital property reports.
Conclusion
At Bricks&Logic, we have developed a unique approach to house price indices by creating a property-level index that offers a detailed view of house price movements across different areas and property types. Our approach combines a comprehensive understanding of each property's characteristics and location with a hybrid model that combines the hedonic approach with machine learning algorithms and data science techniques. By using cluster analysis to understand the trends of areas, property types, and characteristics, we can blend all this information together to give an assessment of how the value of an individual property is moving. Our Bricks&Logic heat map and website enable users to access and explore our indices in a way that has not been possible before, bringing the property market to life.
If you would like to find out more about the Bricks&Logic Index or how Bricks&Logic could help your business please book a demo via our professional page.
Author: Michael Joyner, Chief Data Scientist, Bricks&Logic