Openshaw

A Guide to House Prices in Openshaw, Manchester, M11
Updated Jun 2024
Openshaw contains 98 streets comprising a total of 1,129 properties. The average property price is £161,779 which has increased by 3.7% over the last twelve months. During this time rental prices have increased by 4% for an average rental price of £874 per calendar month.
(12 months)
(12 months)
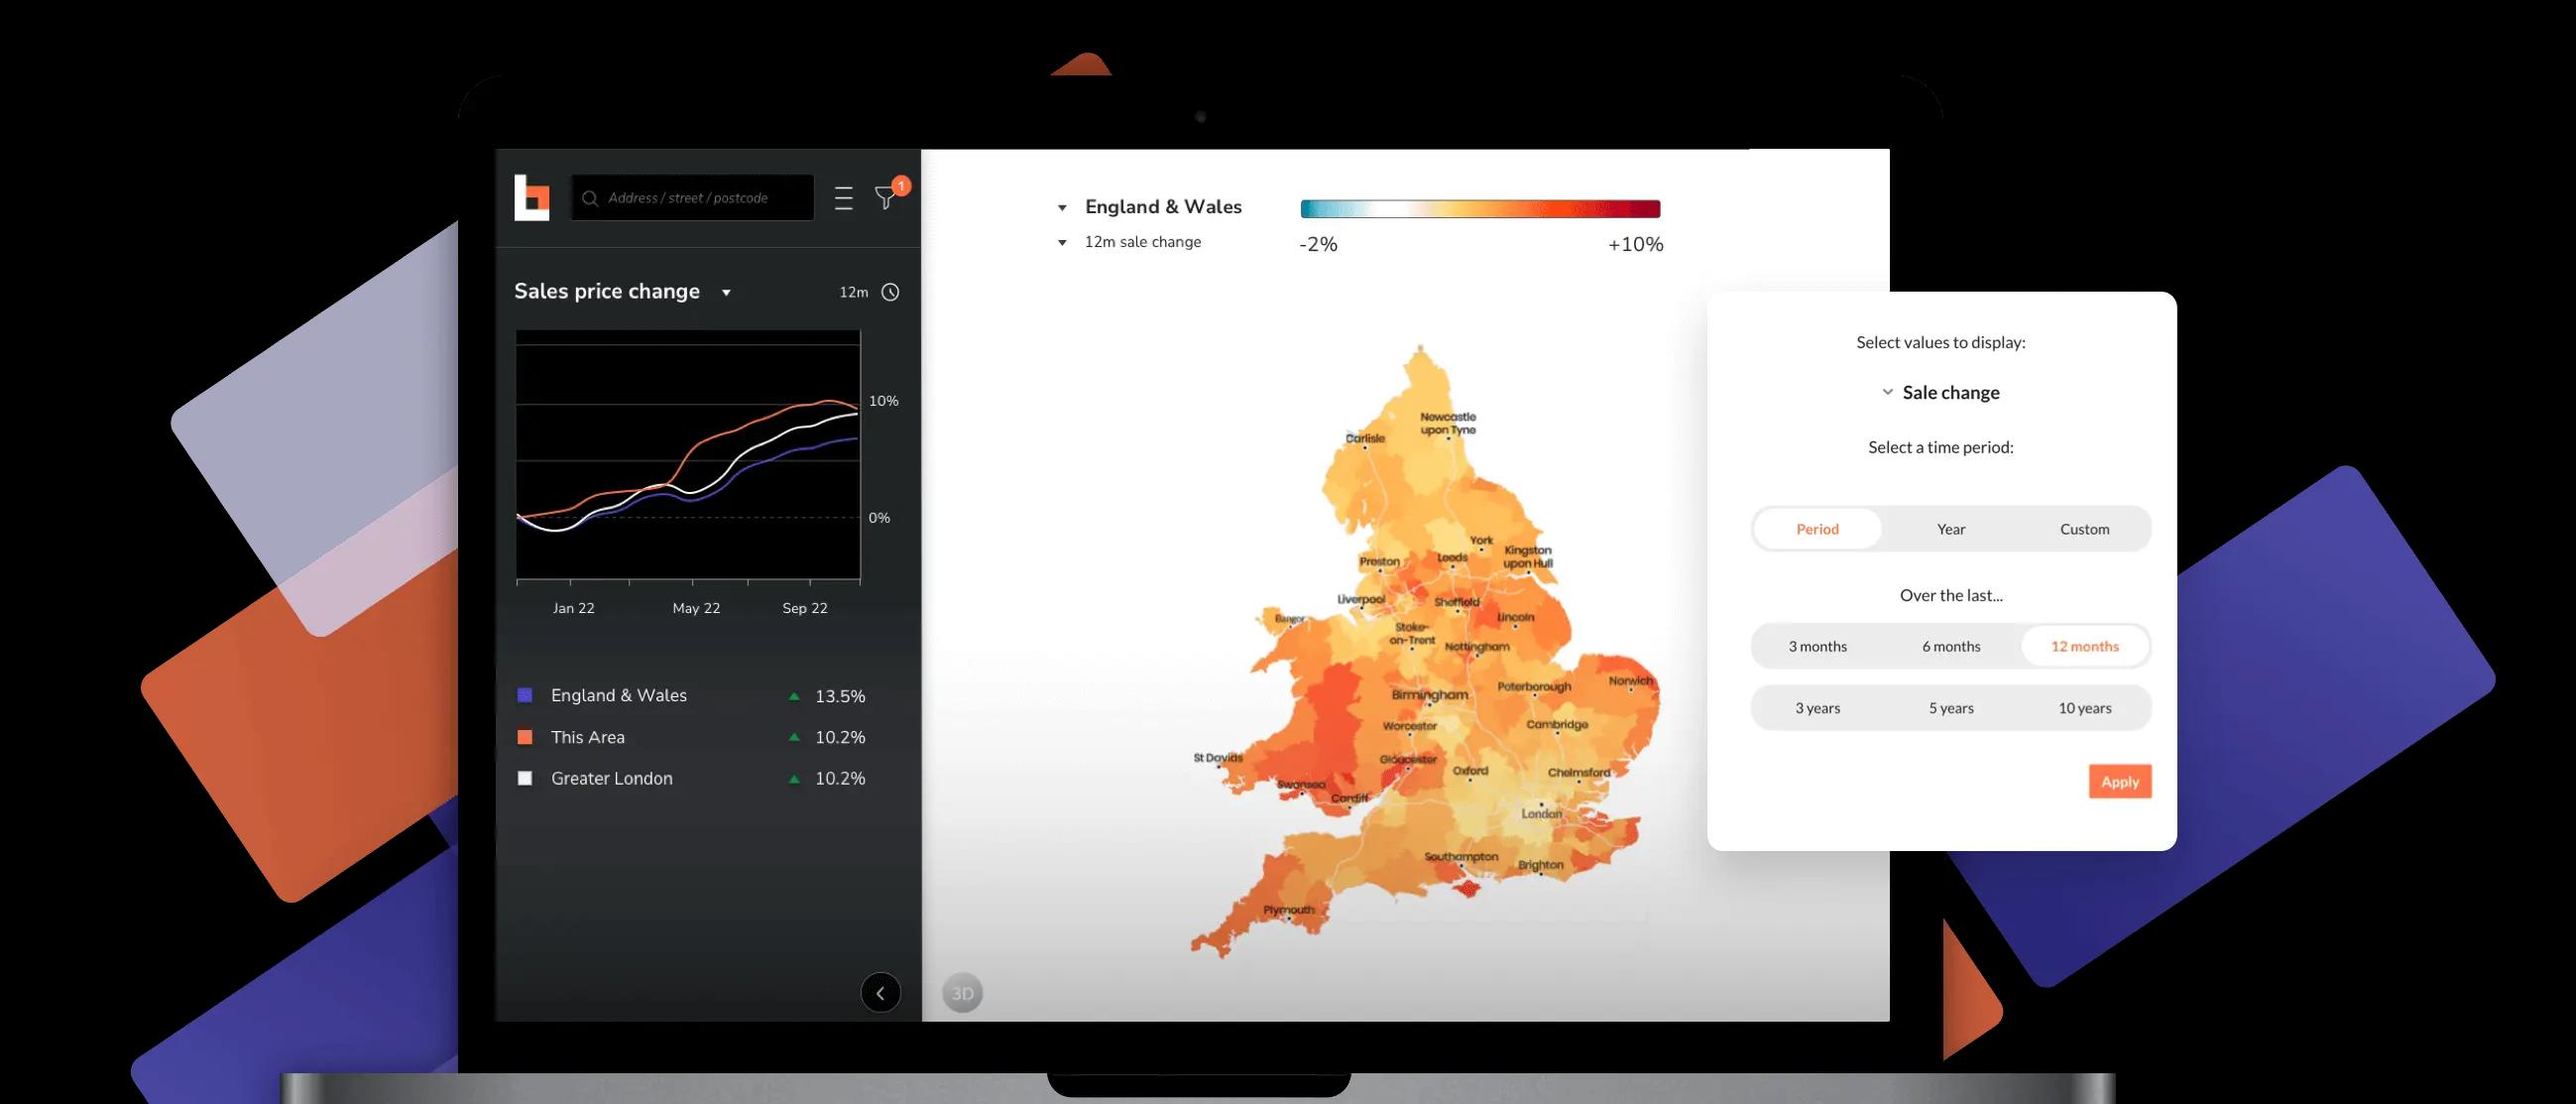
Sales Prices in Openshaw, Manchester, M11
The average sale price in Openshaw is £161,779 and prices range from £84,982 to £401,612.
This chart shows how the area has performed as a whole over the last ten years.
Rental Prices in Openshaw, Manchester, M11
The average rental price in Openshaw is £874 per calendar month and prices range from £468 to £2,093.
This chart shows how the region has performed as a whole over the last ten years as well as the worst and best performing districts in that time.
Streets in Openshaw, Manchester, M11
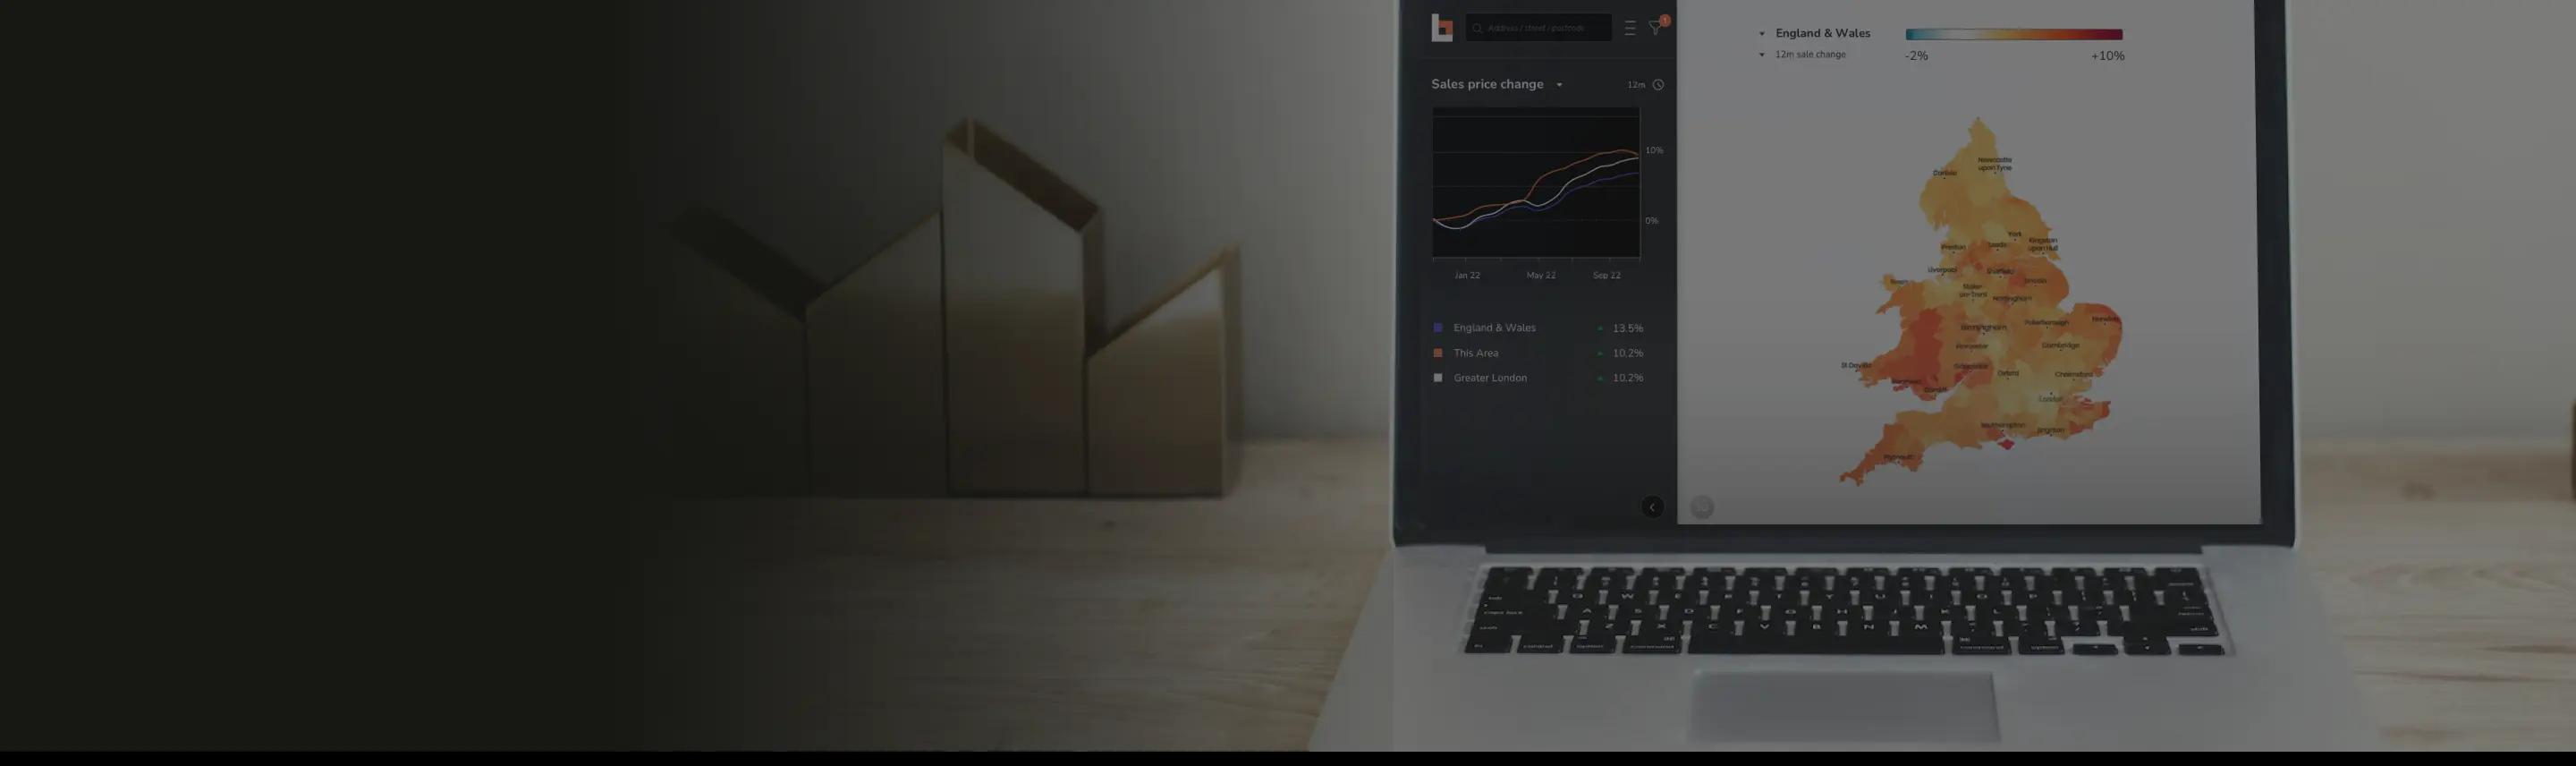
For detailed analysis with colourful heatmaps
Great features
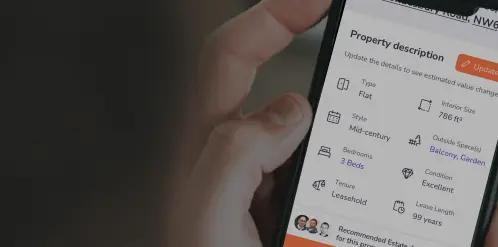
Transparent property data
Using all the available data, we predict key characteristics of 27M+ addresses in the UK.
Market leading price accuracy
We empower everyone in the market with our highly accurate sale and rental estimates for each property.
Easy access
Whether it's finding those streets with your perfect property or understanding the rental pricing across an area, our smart interactive map brings the data to life.