Stay up to date
Stay up to date
Bricks&Logic is a trading name of Urban Markets Ltd
Company No. 11113204
|
VAT No. GB 287 0845 68
Registered Address: 2 Leman St, London E1 8FA
Be the first Estate
Agent here!


Public records show Capenhurst, Pershore to be a period freehold house with 1,819 ft2 of internal area, sitting on a 1,900 m2 plot.
In this area, houses of this size normally have 4 bedrooms with a garden.
Capenhurst, Pershore has an estimated sale value of £408,749 and an estimated rental value of £1,736 per month, assuming reasonable condition and based on the information available.
Main Street, Pinvin, Pershore, WR10 lies in the borough of Wychavon, within the WR10 postal district.

Capenhurst, Pershore has a single entry in the Land Registry from August 2018 and a single entry in the EPC database dated October 2017.
We combine this information with that of neighbouring properties to estimate the property attributes and values.
The local information is scored as 2 out of 5 and is considered of medium accuracy.

In very good condition, we estimate Capenhurst, Pershore would be worth £429,187, with a potential rental value of £1,823 per month.
If substantial cosmetic improvements are needed, the estimated sale value falls to £380,137, with a rental value of £1,615 per month.
The extent to which decoration affects a property's value depends on its type, size and location.


The estimated sale value of Capenhurst, Pershore has grown by £3,467 (0.8%) over the last year. During the same period, its estimated monthly rental value has climbed by £63 (3.6%). The property's estimated gross yield is currently 5.1%.


Capenhurst, Pershore occupies a 1,900 m2 plot as recorded by HM Land Registry.
Of the 21 other houses in this postcode, 18 have recorded plot sizes, and this one ranks as the largest.


Capenhurst, Pershore has an Energy Performance Rating (EPC) of F. This is based on the most recent assessment, dated 18 Oct 2017.
The property is connected to mains gas and has some double glazing. It is heated using Boiler and radiators, mains gas.

Capenhurst, Pershore last changed hands on 14th August 2018, selling for £490,000. The transaction was logged as a freehold house by HM Land Registry.
That is its only recorded sale since 1995.
The market for similar properties has risen by 44.3% since August 2018.

Land Registry records and our Estate Agent network show 3 sales of comparable properties within 1.9 kilometres of Capenhurst, Pershore across the last 2 years.
Most recently, Caradwell, Main Street, Pershore, WR10 2ER, a freehold house, sold at £330,000 on the 2nd April 2025.
Read more about house prices in WR10.
•Nearby is defined as the radius comprising the nearest 2,000 addresses.

Our analysis of the public data ranks Capenhurst, Pershore as the 11th largest and the 34th most expensive of the 54 addresses on Main Street, Pinvin, Pershore, WR10.
Against the WR10 postcode district average, it is £2k more expensive than the typical property.


Pershore station is the nearest stop to Capenhurst, Pershore at 600 metres away.

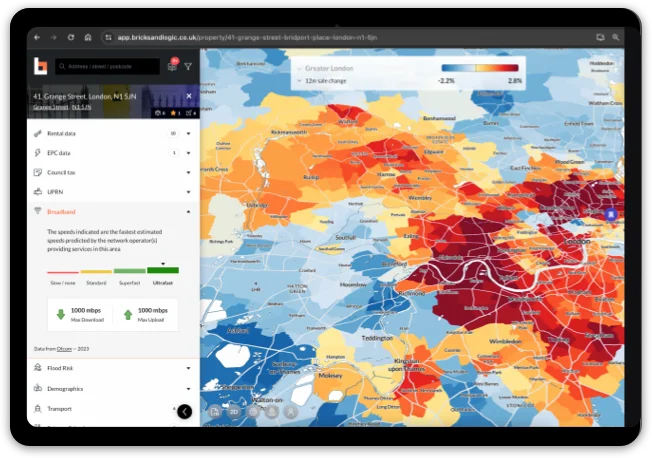
Ofcom's latest figures show superfast broadband available in this area.
According to recent data from Ofcom, Superfast broadband is available in the area.

Environment Agency data suggests this area has a very low risk of flooding.

The recent census recorded whether a resident owned or rented their home.
In the area around Capenhurst, Pershore, % of property is and % is .
The graph below shows how this compares to West Midlands and the rest of England & Wales.

The recent census recorded the highest level of education achieved by residents in the local area.
In the area around Capenhurst, Pershore, 0.0% of residents are recorded as possessing school level qualifications and 0.0% as possessing degree level qualifications.
The graph below shows how this compares to West Midlands and the rest of England & Wales.


The recent census recorded whether a property was a primary or secondary home for the resident.
In the area around Capenhurst, Pershore, 0.0% of property was a second home.
Comparison figures for West Midlands and the rest of England & Wales are listed below.

The recent census recorded the number of cars registered in each household.
In the area around Capenhurst, Pershore, there are an average of 0.0 cars per household.
See below for how this compares to West Midlands and the rest of England & Wales.