Stay up to date
Stay up to date
Bricks&Logic is a trading name of Urban Markets Ltd
Company No. 11113204
|
VAT No. GB 287 0845 68
Registered Address: 2 Leman St, London E1 8FA
Be the first Estate
Agent here!


95, Blackmore Street, Derby is described in the public record as an early-century house with 656 ft2 of internal area, sitting on a 231 m2 plot.
Locally, houses of this size normally have 2 bedrooms with a garden.
Our estimate of the sale value of 95, Blackmore Street, Derby is £112,047 and its rental estimate is £702 per month, given the available information and assuming reasonable condition.
Blackmore Street, Derby, DE23 falls within the DE23 postal district.

95, Blackmore Street, Derby has no records in the the Land Registry and a single entry in the EPC database dated November 2018.
We combine this information with public data of neighbouring properties to estimate the property attributes and values.
The local information is scored as 4 out of 5 and is considered of high accuracy.

The condition of a property plays an important role in determining its value, with the degree of impact varying by property type, size and location.
For 95, Blackmore Street, Derby, we estimate a market value of £117,649 and a rental value of £738 per month when presented in very good decorative order. Should the property require extensive cosmetic improvement, those figures would reduce to £104,204 and £653 per month respectively.


Over the last year, 95, Blackmore Street, Derby has seen its estimated sale value move up by £839 (0.7%) and its estimated rental value increase by £24 per month (3.4%). This results in an estimated gross rental yield of 7.5%.


HM Land Registry records the plot of land for 95, Blackmore Street, Derby as measuring 231 m2.
That makes it the 10th largest plot in the postcode, where 13 of the 27 other houses have recorded plot data.


95, Blackmore Street, Derby has an Energy Performance Rating (EPC) of D. This is based on the most recent assessment, dated 23 Nov 2018.
The property is not connected to mains gas and has fully double glazed windows. It is heated using Electric storage heaters.

Over the past 2 years 3 properties similar to 95, Blackmore Street, Derby have sold within a radius of 550 metres, per the Land Registry and our network of Estate Agents.
The latest, on the 4th October 2024, was 83, Blackmore Street, Derby, DE23 8AX, a freehold house which sold for £134,000.
Read more about house prices in DE23.
•Nearby is defined as the radius comprising the nearest 2,000 addresses.

Of the 127 addresses on Blackmore Street, Derby, DE23, 95, Blackmore Street, Derby comes out as the 106th largest and the 46th most expensive in our analysis of the public data.
It is also £110k less expensive than the average property across the DE23 district.


From 95, Blackmore Street, Derby, the nearest station is Peartree, 1.1 kilometres away.

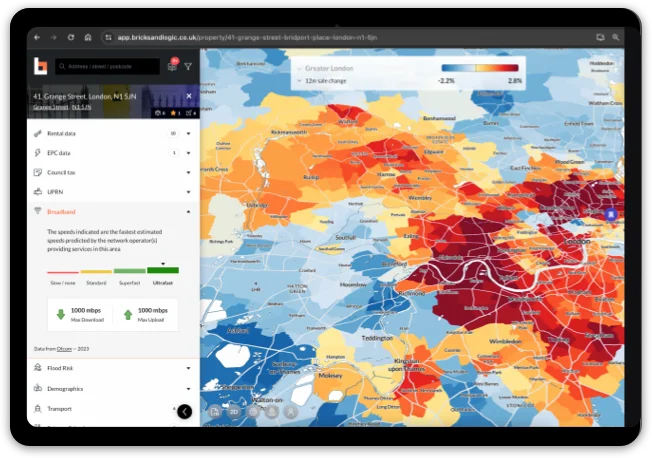
Broadband here reaches ultrafast speeds, based on recent Ofcom data.
According to recent data from Ofcom, Ultrafast broadband is available in the area.

The flood risk here is rated very low, based on Environment Agency data.

The recent census recorded whether a resident owned or rented their home.
In the area around 95, Blackmore Street, Derby, 55.9% of property is socially rented and 18.6% is privately owned with a mortgage.
The graph below shows how this compares to East Midlands and the rest of England & Wales.

The recent census recorded the highest level of education achieved by residents in the local area.
In the area around 95, Blackmore Street, Derby, 27.9% of residents are recorded as possessing school level qualifications and 19.0% as possessing degree level qualifications.
The graph below shows how this compares to East Midlands and the rest of England & Wales.

The most recent census in 2021 recorded the age of all UK residents.
In the area around 95, Blackmore Street, Derby, the average age was 34.3 and the most common age was 12.
The graph below shows how this compares to East Midlands and the rest of England & Wales

The recent census recorded whether a property was a primary or secondary home for the resident.
In the area around 95, Blackmore Street, Derby, 0.0% of property was a second home.
Comparison figures for East Midlands and the rest of England & Wales are listed below.

The recent census recorded the number of cars registered in each household.
In the area around 95, Blackmore Street, Derby, there are an average of 0.7 cars per household.
See below for how this compares to East Midlands and the rest of England & Wales.